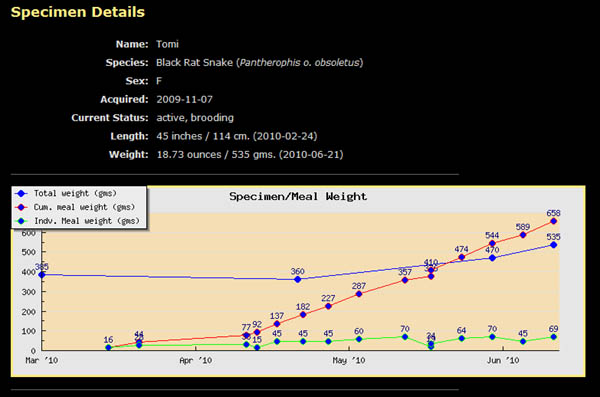
I just added a graphing feature to my tracking application so that IF you enter feeding and meal weight data you get a nice graph like the following. Of course the value of the graph is dependent on complete data entered over an extended period and I've only been using this for a few months.
Can't weight to start with some hatchlings and see how it looks after a year or two - especially with some variance in meal weights, frequency, say like mice vs. rats etc. I think that ultimately this will help to optimize feeding efficiency to maximize growth and minimize cost.
There is a graph for lenght too but I've been slack about measuring as it's such a pain. Gotta figure out a consistent way to do that - yeah, I know all the regular methods but they all have issues and some snakes are just totally uncooperative 
The graphs only show if you have a minimum data set and are public as set on a per specimen basis.
Anyway, if you're interested in doing something like this, let me know and I'll help get you set up.
-----
 See all my snakes at SerpenTrack.com